Takin’ a minute
From the discussion at City Council and the online feedback I received from the previous article, both asked for equity measures to define the problem and success.
Today’s article builds upon coverage of public meetings (one, two, and three), to examine the assumptions and biases behind the Equitable Housing Strategic Plan, define the equity gaps, and recommend equity-based actions or measurements.

Click here for a PDF of the framework, top 10 takeaways, and proposed equity measures.
Why care
Without examining underlying biases and gaps, we will continue to perpetuate a system that produces racist outcomes. Housing has a direct impact on the following racial equity gaps:
K-12 education achievement gap by race in West Linn-Wilsonville School District
Affordable housing access and household income gap by race in Wilsonville
Racially and economically integrated neighborhoods and schools in the West Linn-Wilsonville School District
For an understanding of the historic role that housing plays in creating and perpetuating racial division, check out reports from Clackamas County or the City of Portland.
Systemic problems need systemic solutions. Too often housing analysis does not go far enough to examine the underlying assumptions and biases involved in data collection. Equity gaps in the analysis will lead to (at best) short-term, non-sustainable solutions.
Housing deep dive
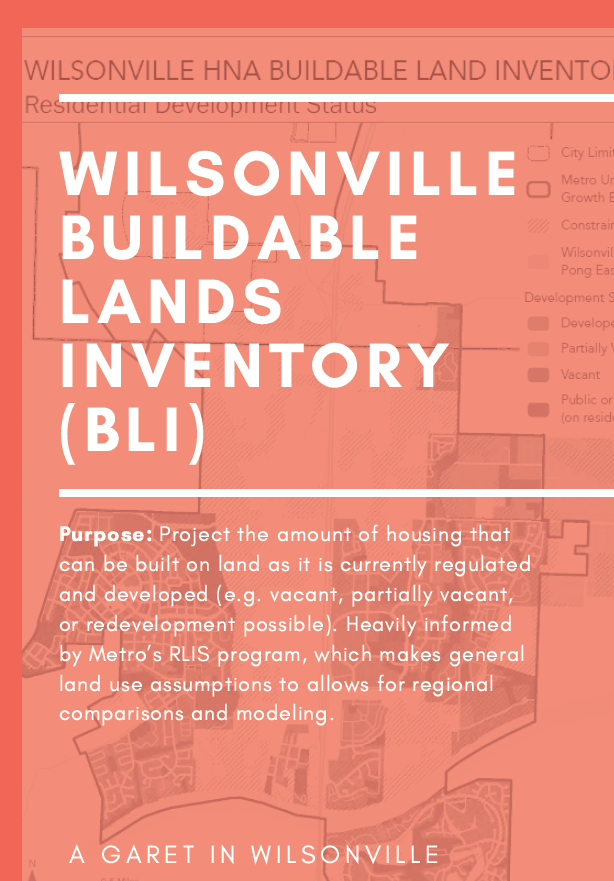
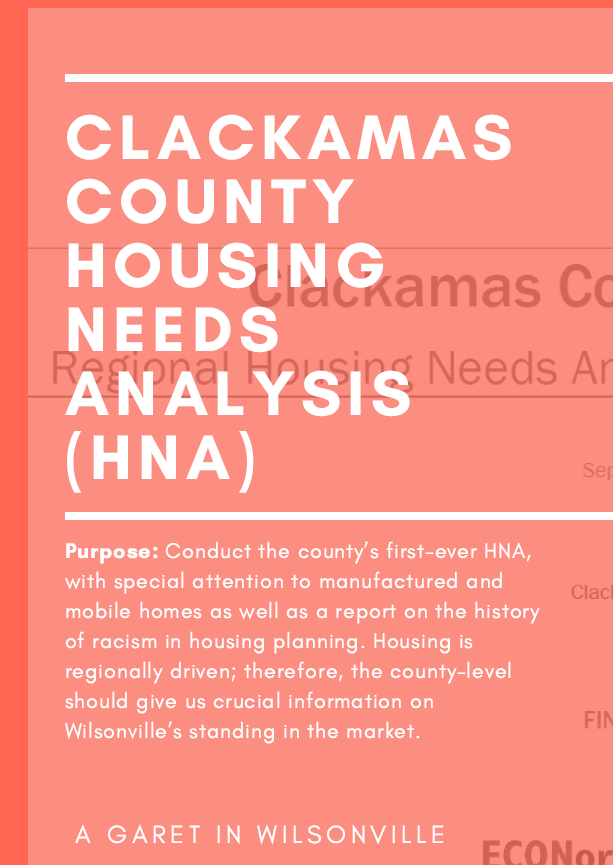
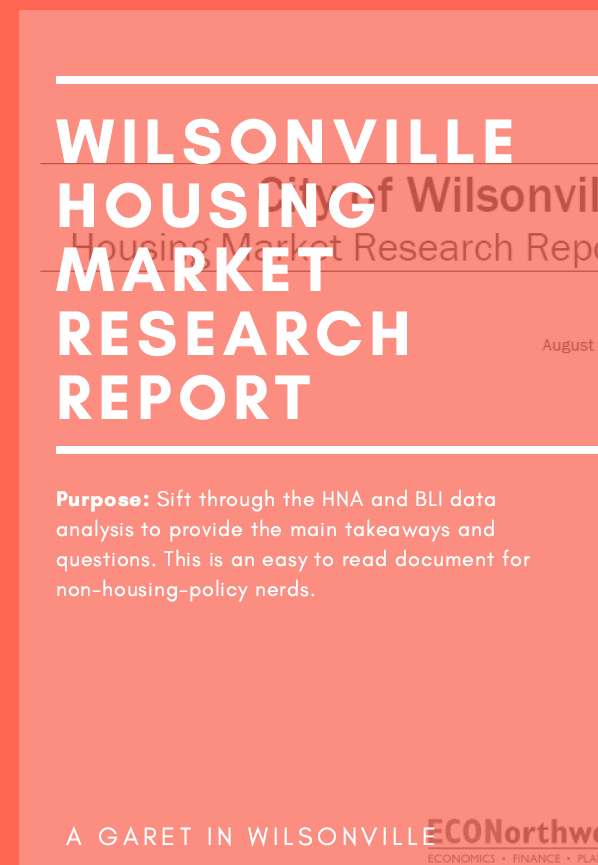
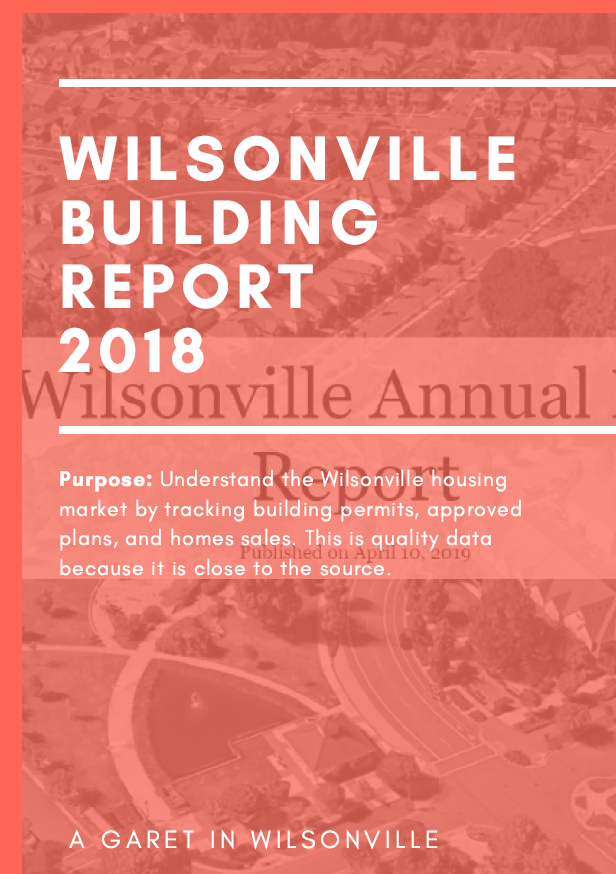
Put on your scuba gear, cause’ we are about to take a deep dive into Oregon’s housing policy, planning, and data system! We start with the following diagram that explains framework for Wilsonville’s Equitable Housing Strategic Plan:
My impressions:
ECONorthwest plays a large role, so we should really dig into their methods to examine how racial equity informed data gathering and analysis. Furthermore, with recent legislation that requires routine housing analysis (HB2001 and HB2003), ECONorthwest - who is the industry leader in this work - is going to be a massive player in Oregon’s housing future.
The Census and Metro’s RLIS are known to underestimate counts for racial minority groups. We should examine the analysis reports to see if this is recognized and supplemented.
How is equity being measured? At the last City Council meeting, city staff and the consultants were tasked with developing equity goals and measurements. We should explore these documents to find what measurements best address racial equity gaps.
Examining the assumptions, biases, and identifying equity gaps
For the aspiring housing-policy nerd (which is hopefully you), I provide an in-depth examination of the purpose, key takeaways, and assumptions, biases, or equity gaps for each analysis-level document at the end of this post.
For those who want a quick recap from 500+ pages of technical documents, here are my top 10 takeaways:
ECONorthwest best achieves equity when given political direction, as they were in Clackamas County (mobile and manufactured homes) and Wilsonville (equity). They are Oregon’s housing analysis leaders for their understanding of the market. Their knowledge of the local market and data gaps (e.g. questioning Metro’s RLIS assumptions) informs their economic modeling for existing conditions, demand, and future need projections.
ECONorthwest’s analysis could be improved if they factored income into projected housing need, because a full accounting is necessary to understand systemic brokenness. Future housing needs are based on housing type, buildable land, and Census population. Income is only added to give a current (2018) snapshot of housing needs (Exhibit 28). If housing prices continue to rise at their current rate and wages remain stagnant, the future need would be massive at almost all income levels.
The Wilsonville Housing Report helps address equity data gaps in the US Census, whose broad estimates are known to under-count minorities, and Metro’s RLIS, whose regional land use categories don’t always reflect local context.
ECONorthwest’s process leaves input from hard to reach groups as a separate and qualitative (not measured) process, which is problematic. In government, if you do not measure something, you will not see it happen. Equity measures will be a critical component of equitable action.
Wilsonville is a city of two halves. Only 9% of homes are middle income. There are the people who rent (56%), and 42% of them pay more than 30% of their budget on housing (cost-burdened). On the flip side, compared to similar cities in Clackamas County, Wilsonville has the highest percentage of households (14%) making more than $150,000 a year (Milwaukie is next at 6%).
Wilsonville struggles with homeownership and has the lowest percentage (44%) in all of Clackamas County. The city experienced a 57% increase in home sales price over the last 5-years (222% in the last 10-years) and the picturesque American-homeownership-generational-wealth-building dream (which is backed by federal subsidies) is not affordable to over half of Wilsonville’s residents.
If housing trends continue and income remains stagnant, in 2021, a Wilsonville household would have to make 225% of the median income ($141,968/year) to buy a home and not be cost-burdened. Currently, they would have to make 185% of the median income ($116,550/year) to afford the average home sales price ($454,400).
Wilsonville’s ratio of housing price to resident salary (5.5 years) is the highest among our comparison cities and only bettered by Lake Oswego and Rivergrove (5.7) in Clackamas County. Richard Florida’s rule is that your home should roughly equal 2.6 years of salary. ECONorthwest has Wilsonville’s ratio at 5.5 years, but my calculations show it even higher at 7.4 years ($454,000 median home value / $63,097 median household income).
Although Wilsonville is divided by income, it does a decent job with geographic integration. The free and reduced lunch student mix in our schools (20% to 40% range) shows that lower-income families are not segregated into one school. This is not the case in many suburban school systems. Also, other communities may show a similar housing mix of multifamily to single-family, but multifamily homes are segregated and placed near busy roads or environmentally sensitive/polluted land. For the most part, this is not the case in Wilsonville.
None of the analysis accounts for transitional housing, which is a crucial element of the housing affordability picture. Also, at 449 county-level subsidized homes, Wilsonville is comparable to Oregon City (610) and Milwaukie (322). West Linn’s limited offering of 10 county-level subsidized homes really stands out as a low point.
Recommended equity-based actions or measurements
Set targets for neighborhood integration by requiring a minimum of affordable housing in a new development with over 200 homes (inclusionary zoning) and set policy targets for integration in established neighborhoods to support infill and redevelopment.
To maintain the economic and racial integration in our schools, establish policies to guide decisions for student enrollment and school zones.
For single-parent homes with children, set a target to reduce the number of cost-burdened homes and increase the percentage of homeowners, to be equal to that of two-parent households.
Create a target to erase the racial gap for homeownership and cost-burdened homes in Wilsonville.
Assess the need for transitional housing and provide a target to provide the number of homes to meet that need.
Require future housing data collection and analysis (e.g. HNA, BLI, etc.) to include an equity-based group of people to provide input, feedback, and identify equity measures.
What are your thoughts?
Do my takeaways represent your experience in Wilsonville? Do you agree or disagree with the data or critiques of the process? How would you measure equitable housing?
I would love to hear from you and I encourage you to speak out!
Click below to contact me or go to the Act page and in one click, you can email City Council or other elected groups.
Even Deeper Dive
The following includes the source document along with my examination (e.g. purpose, key takeaways, and assumptions, biases, or equity gaps) for each analysis-level document: